1 / 12
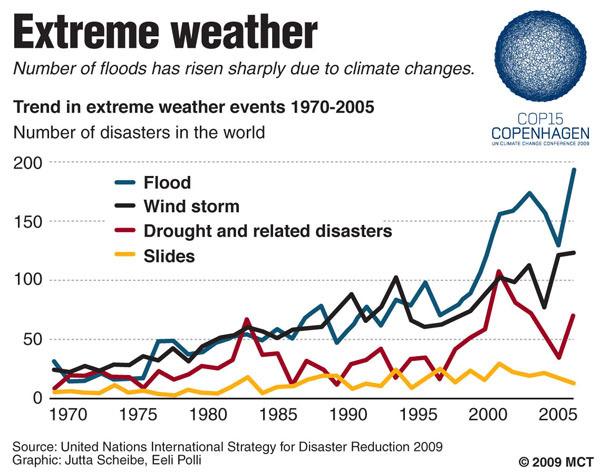
Study the graph. Which of the following is true?- The number of land slides increased by 400% between 1970 and 2005
- The worst year for flooding was 2001
- The worst year for drought was 2005
- The number of floods in the world increased from about 20 in 1970 to nearly 200 in 2005

This graph is a- pictogram
- line graph
- pie chart
- bar chart
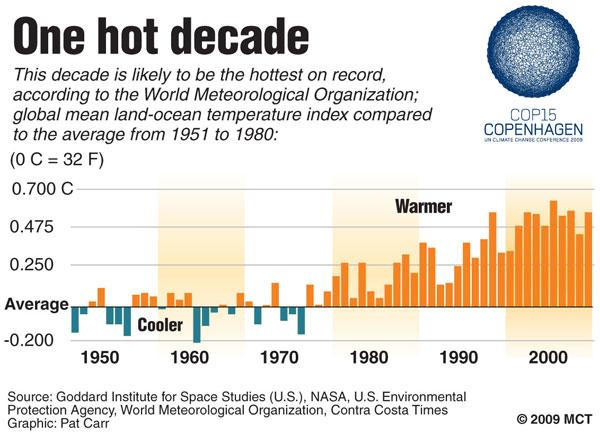
This is a- pie chart
- bar chart
- pictogram
- line graph

This graph shows that- since 1970 the worlds temperature has increased by 0.9 degrees centegrade.
- 1980-1989 was the hottest decade.
- the world has got hotter with each decade since 1960.
- the world's temperature isn't changing.
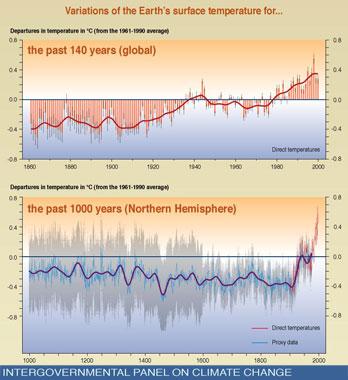
Look at the top graph. It shows that- in 1940 the earths temperature was 0.
- in the last 140 years the earth's temperature has been constant.
- in the last 140 years the earth's temperature has been rising.
- in the last 140 years the earth's temperature has been falling.

Look at the bottom graph. It shows- that the coldest year was 1600.
- nothing, because the data is "proxy".
- that there was an ice age between 1000 and 1900.
- that temperatures between 1000 and 1900 were similar, but in the last century they have risen dramatically
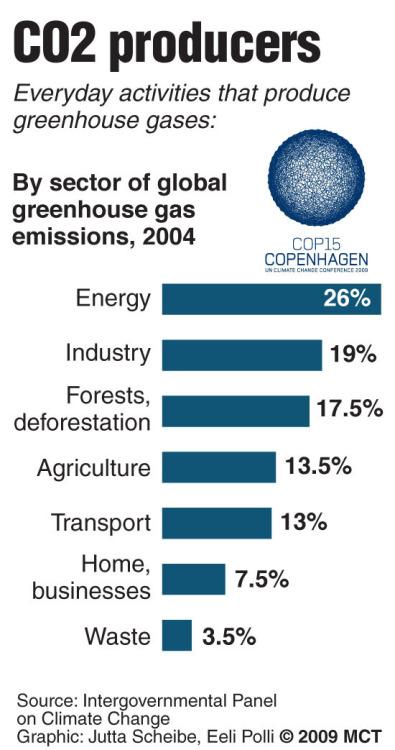
This bar chart shows that- in 2004 CO2 production was increasing.
- in 2004 energy production was responsible for more than a quarter of all CO2 production.
- in 2004 agriculture produced less than a tenth of CO2 emissions
- in 2004 over one fifth of CO2 production was produced by industry.

A good way to represent this data so it shows the proportions of CO2 that each sector produces would be- a pie chart.
- a pictogram.
- a scatter diagram.
- a line graph.
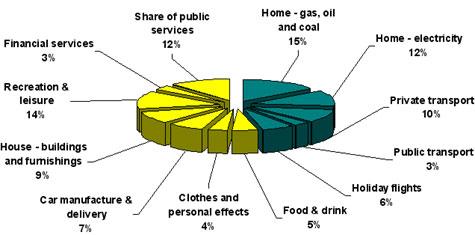
What is wrong with this chart?- It has no title
- The percentages don't add up to 100%
- The angles don't add up to 360 degrees
- The electricity sector should be bigger.

What type of chart is this?- Three dimensional pie chart
- Scatter diagram
- Histogram
- Circle diagram

This chart shows that- using electricity in the home accounts for less than a tenth of emissions
- a quarter of most peoples emissions result from transport
- 27% of most people's carbon emissions comes from fueling their home.
- flying accounts for a tenth of most people's emissions
- Would you like to investigate your carbon footprint?
- Investigate my carbon footprint.