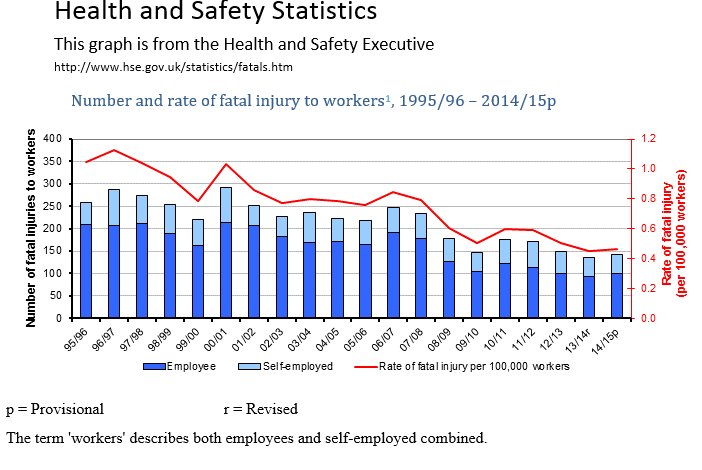
How would you describe the trend in the rate of fatal injury per 100,000 workers between 1996 and 2010?- There is a downward trend.
- There is an upward trend.
- There is little change in the number of fatalities

How would you describe the trend in the rate of fatal injury between 2010 and 2015?- There is a strong downward trend.
- There is an upward trend.
- There is little change in the number of fatalities

According to the graph how many worker fatalities were there in 2014/15?
Which was the worst year for the number of fatal accidents?- 2000/01
- 1996/97
- 2013/14
- 1997/98

Which was the worst year for the number of fatal accidents per 100,000 workers?- 2000/01
- 1995/96
- 1996/97
- 1997/98

What does the p next to 2014/15 mean?
In 2014/15 the rate of fatal injury was 0.46 deaths per 100,000 workers. If there were 142 deaths, how many workers were there in total?
In 2013/14 there were 136 worker fatalities. In 2014/15 there were 142. What was the percentage increase? (give your answer to one decimal place)
In 1995/6 what was the approximate ratio of deaths of employees to self employed people?- 4:1
- 1:4
- 1:3
- 3:1

In 2014/15 what was the approximate ratio of deaths of employees to self employed people?- 5:1
- 4:1
- 3:1
- 2:1

Make a comment about the trend in the proportion of employed and self employed accidents.- The proportion of self employed people involved in fatal accidents is growing.
- The proportion of employees involved in fatal accidents is growing
- The proportion of self employed people involved in fatal accidents is falling.
- The proportion of self employed people involved in fatal accidents is roughly constant